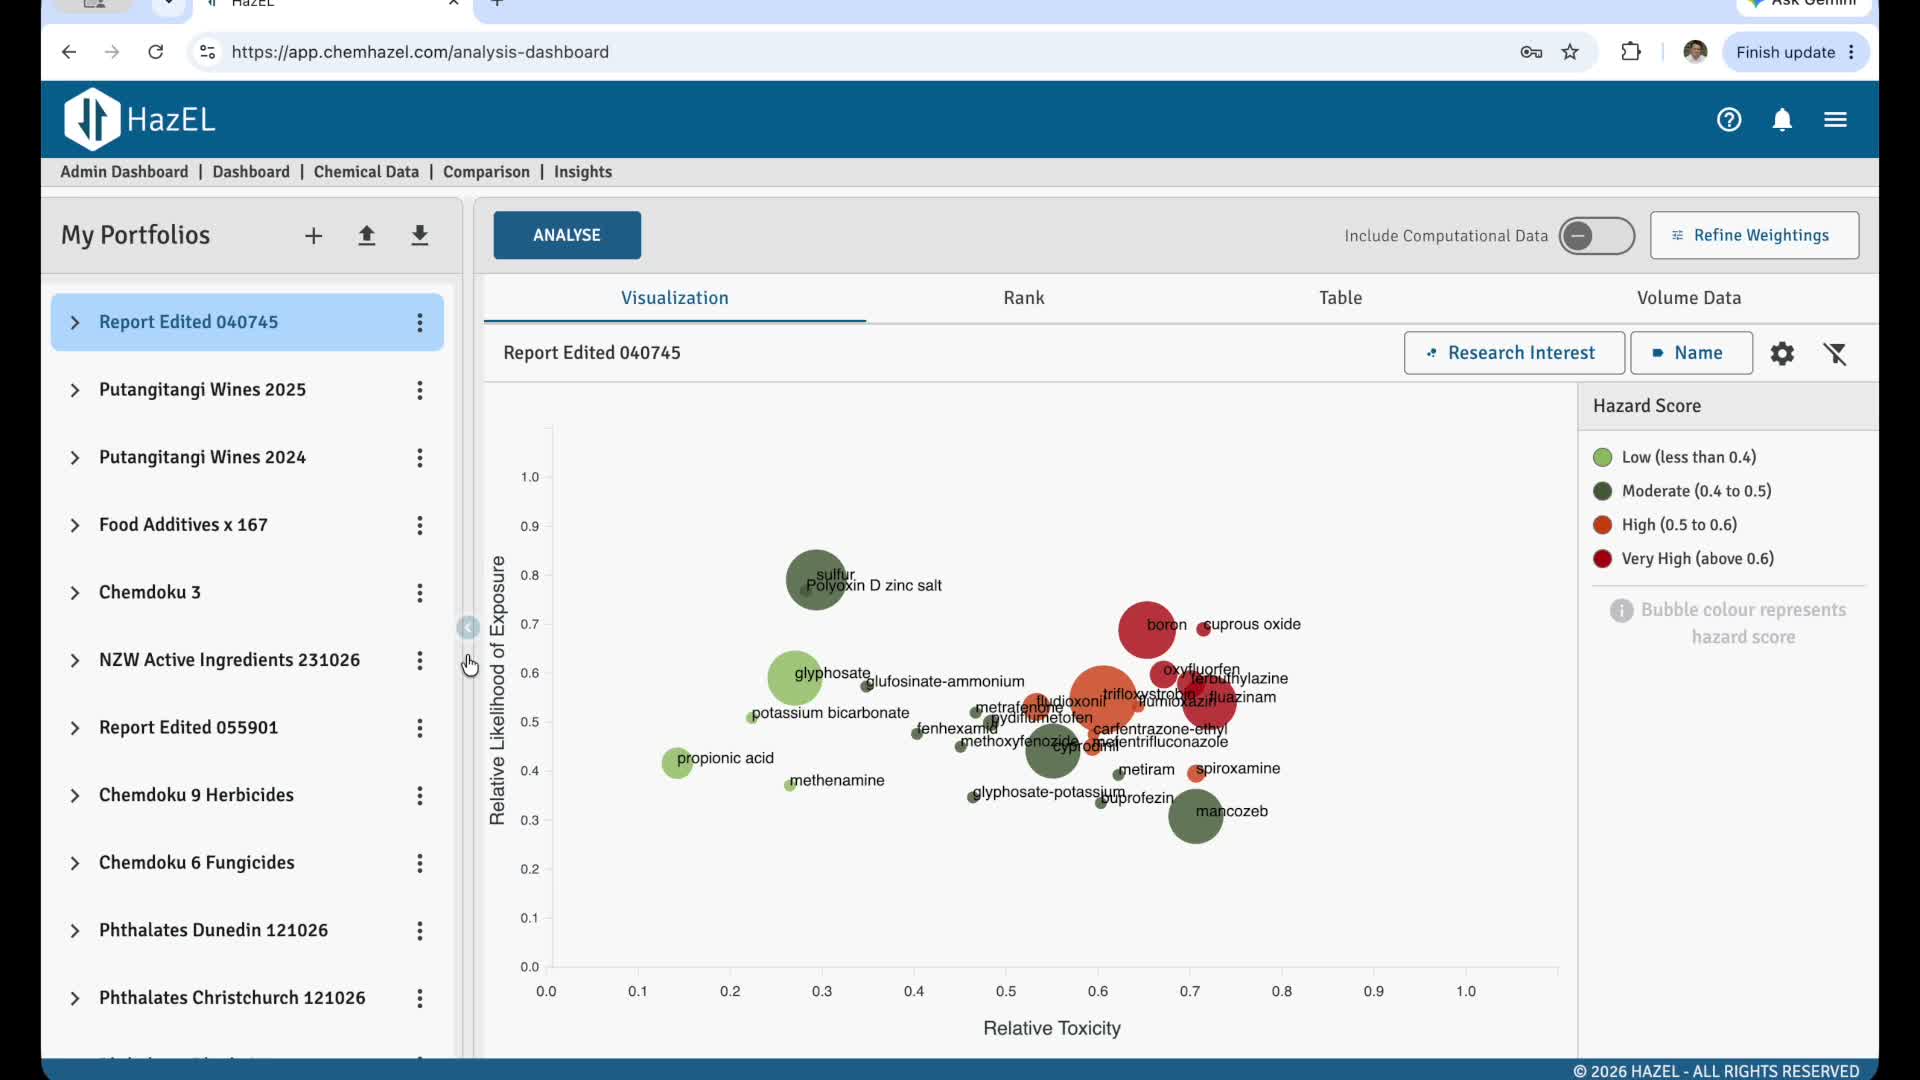
Comparison Screen
The Comparison Screen shows a ‘bump chart’. The top ten chemicals with worst toxicity or highest exposure are shown.
The typical use is to use different weightings to see which chemicals are consistently ranked highly and which move. ‘Acute Only’ and ‘Chronic Only’ apply to Toxicity, while ‘Degradability Only’ and ‘Volume Only’ apply to Exposure. The user can change the weightings and the titles of the weightings groups.
Note that applying Toxicity weightings to an Exposure chart will result in a set of flat lines, because there is no difference in the analysis.
Multiple portfolios can be compared. This relies on them having overlapping lists of chemicals, and for the chemicals to have Volume data entered. Otherwise the chart will either be just distinct points or flat lines.